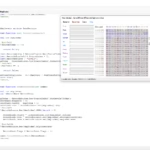
DLL Export Viewer v1.66 – View Exported Functions & Memory Addresses
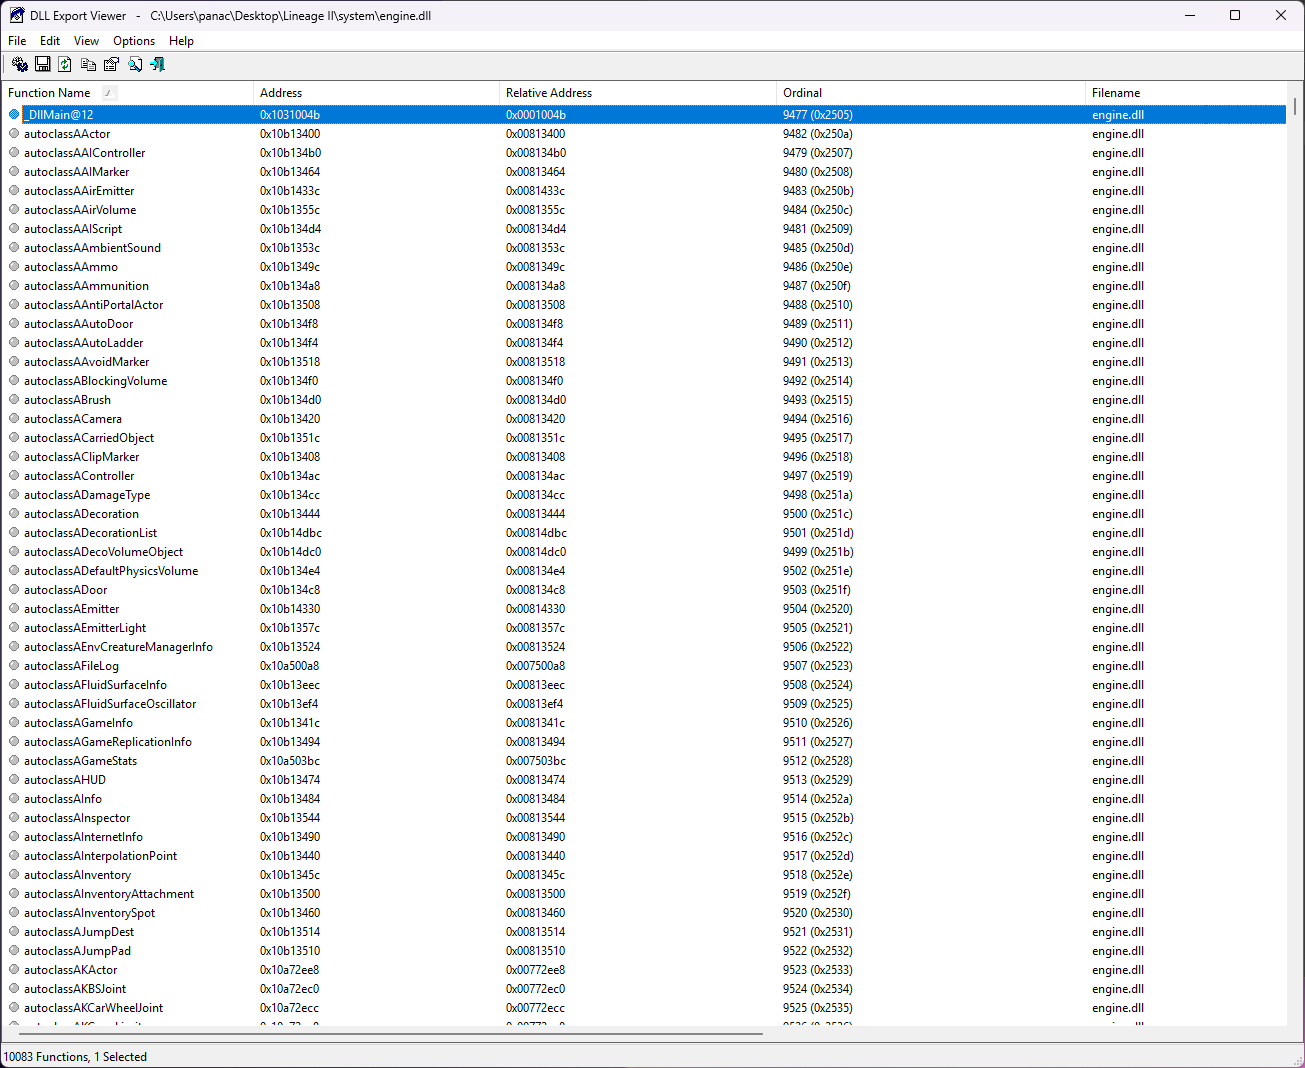
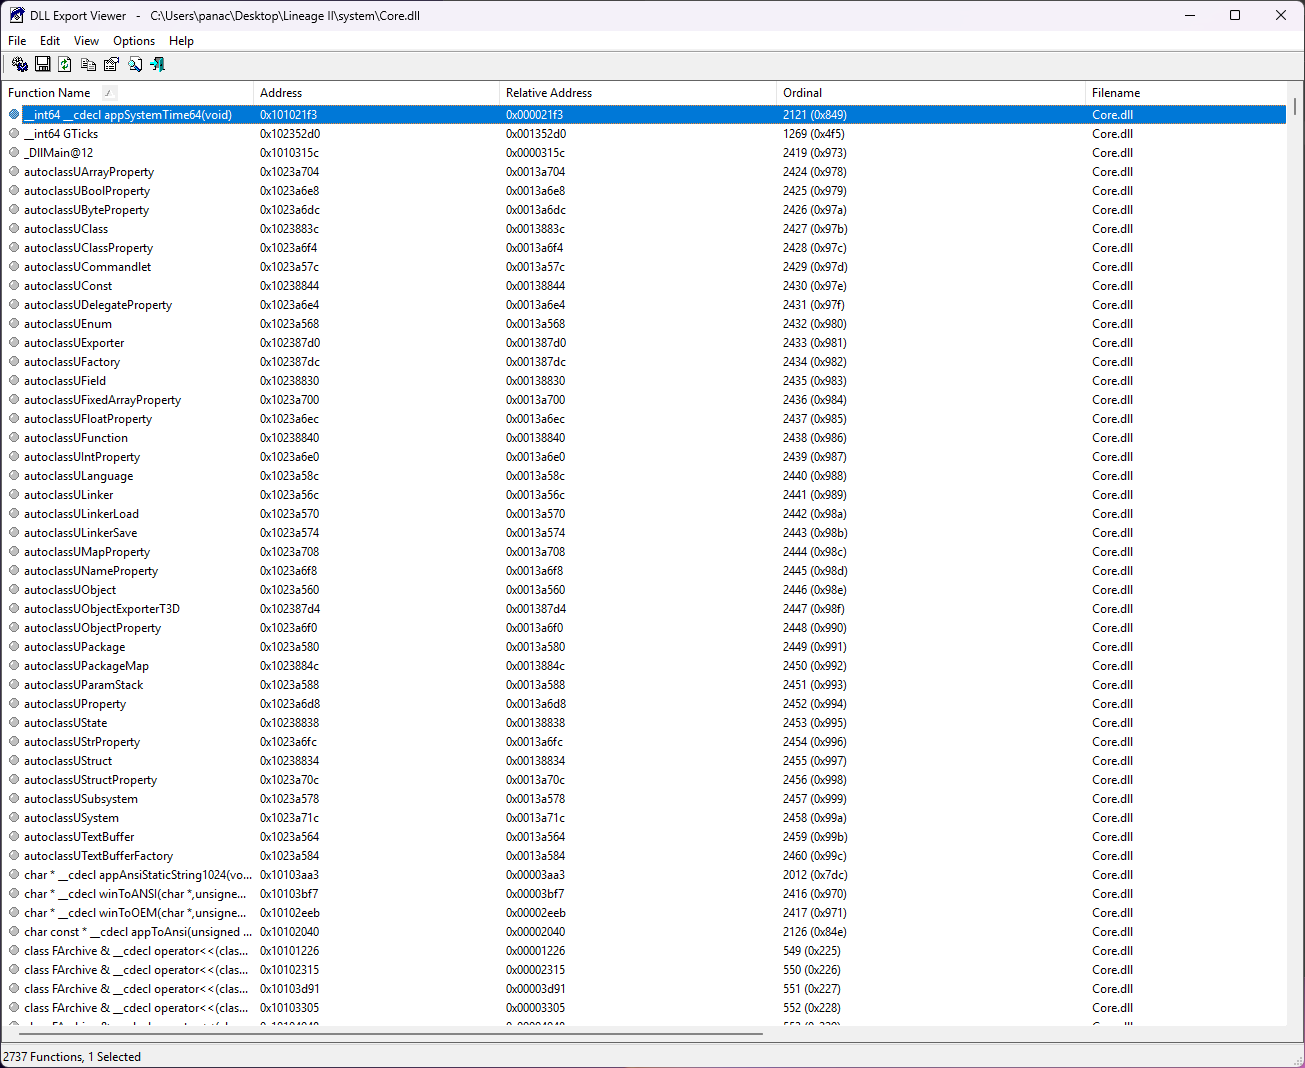
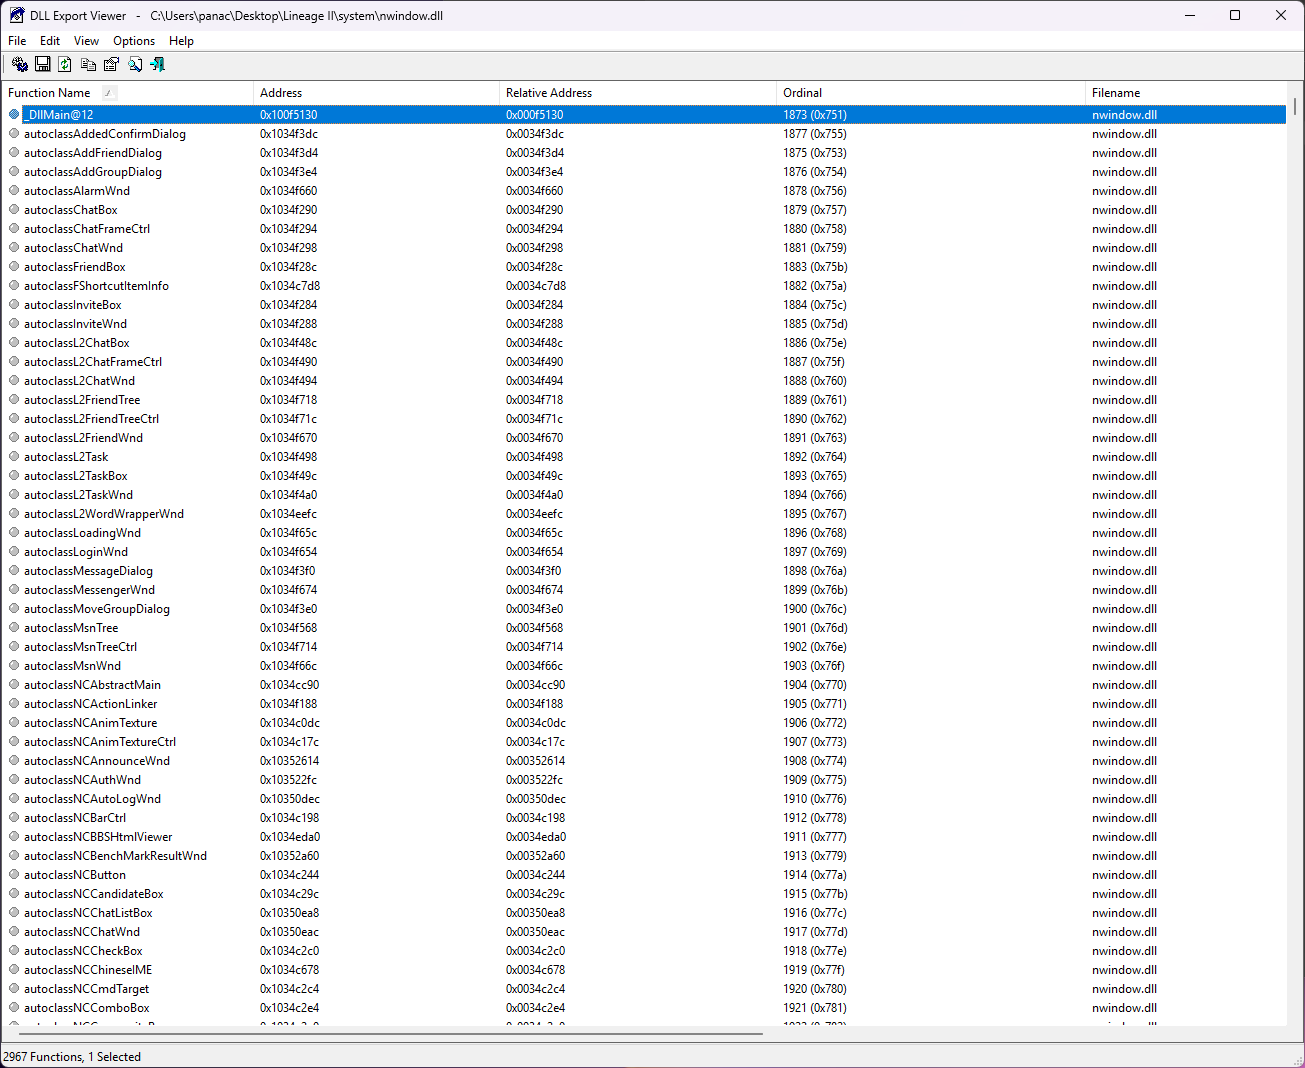
Looking for a tool to analyze DLL files? DLL Export Viewer v1.66 is a powerful utility that allows you to view all exported functions from .dll files along with their virtual memory addresses.
It is widely used for debugging, reverse engineering, and Lineage 2 client analysis, helping developers quickly locate functions and set breakpoints.
Features
- View exported functions from DLL files
- Display virtual memory addresses for debugging
- Load DLLs from files, running processes, or system libraries
- Advanced search and filtering options
- Export results to TXT, HTML, XML, and CSV formats
- Supports command-line usage for automation
How to Use
- Extract DLL-Export-Viewer-v1.66.zip
- Run dllexp.exe
- Select how you want to load DLL files (file, process, or system)
- Choose the DLL file(s) to analyze
- Browse exported functions and memory addresses
- Copy function addresses for use in debugging tools
- Optionally export the results (HTML, TXT, XML, CSV)
Automation
Supports command-line usage, allowing you to automate DLL analysis and export results efficiently.
Compatibility
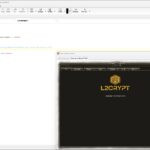
Compatible with Windows systems and works with DLL files from Lineage 2 and other applications.
Why Use DLL Export Viewer?
DLL Export Viewer is an essential tool for developers working with low-level code, debugging, and reverse engineering.
It provides quick access to exported functions and memory addresses, making it especially useful for Lineage 2 client analysis and modification.
Credits
Developed by NirSoft
What others are saying
There are no contributions yet.